Nên dùng khoảng 20 phút · tối thiểu 150 từ
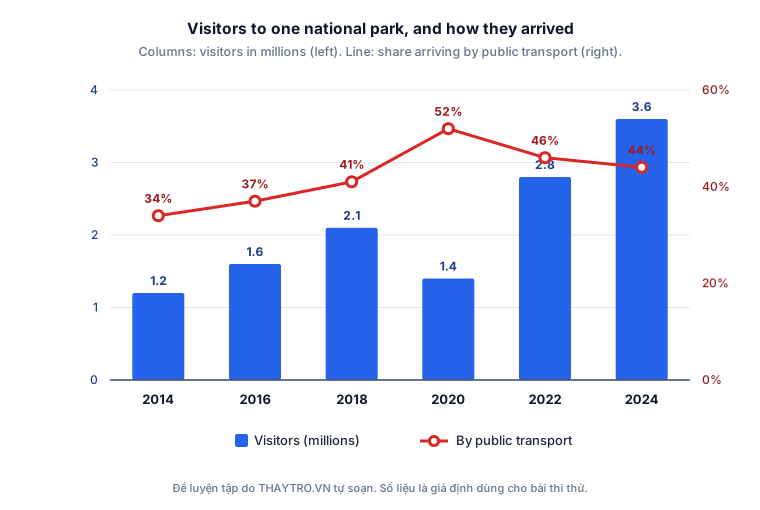
The chart below shows the number of visitors to one national park between 2014 and 2024, and the percentage of those visitors who arrived by public transport. Summarise the information by selecting and reporting the main features, and make comparisons where relevant. Write at least 150 words.
0 từ · còn thiếu 150 từ so với mức tối thiểu